30th September 2021
“How to bring the city closer to people? Using Spatial Network Analysis to create a 15-minute City”.
1/ Event presentation
The European Transport Conference (ETC) is held annually, inviting different actors from the transport sector such as researchers, policy makers and professionals who work at the European, national, regional and local level.
The 49th annual ETC conference was held between 13th September and 15th September. Because of COVID-19 restrictions, the conference was held online.
The key conference themes included:
- COVID-19 and its consequences
- The Climate Emergency
- Inclusion and Diversity
2/ Topic presented
Sara Nalaskowska wrote a paper on the topic “How to bring the city closer to people? Using Spatial Network Analysis to create a 15-minute City”. It was presented as part of the “Data and Inclusive Mobility” session held by the Young Researchers’ and Practitioners’ Forum. The paper focuses on using spatial network analysis combined with point of interest data (POIs) as a supporting tool to design accessible and diverse urban areas in the spirit of the 15-minute city.
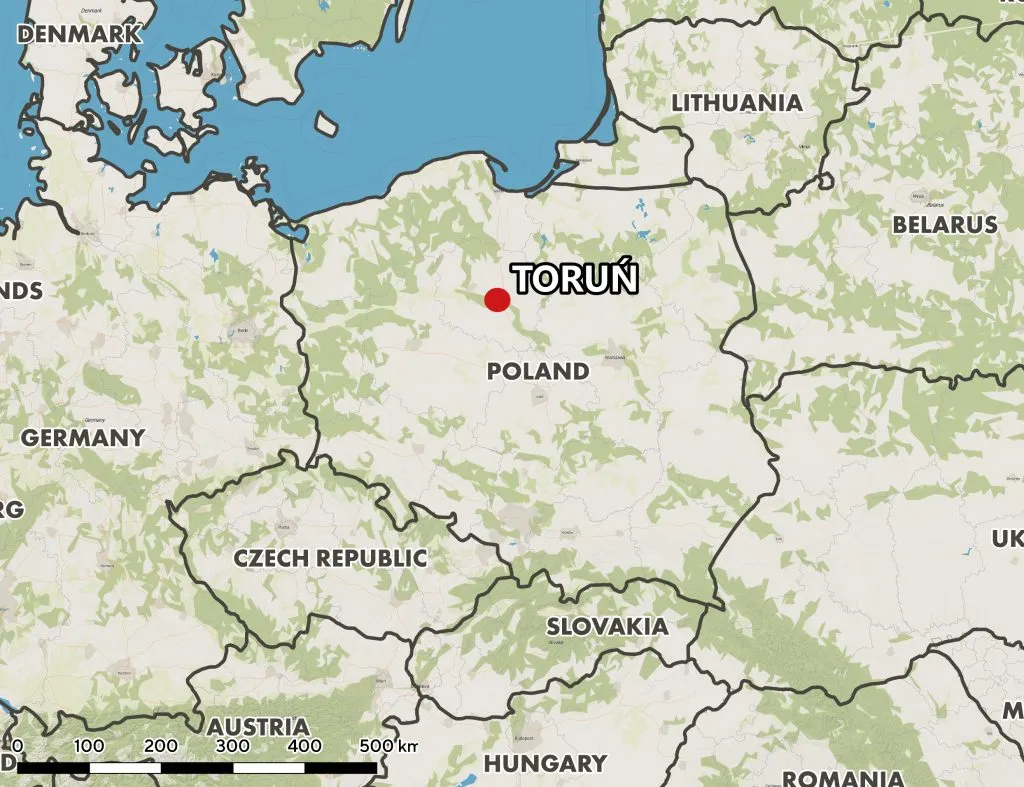
In her paper, Sara introduces two new analytical metrics: land use proximity and functional completeness, addressing the deficiency in quantitative tools that can support evidence-based planning of 15-minute cities and similar. The motivation behind the topic was the need for a paradigm shift in transport planning from mobility to accessibility, necessary to tackle climate emergency and improve quality of urban life. The metrics were presented on the example of a neighbourhood in Toruń, Poland.
3/ 15-minute city – novel analytical tools
15-minute city concept
The popular concept of a 15-minute city proclaimed by Carlos Moreno describes an urban area where all essential services are accessible within a 15-minute walking or cycling distance, following the observation that quality of urban life is inversely proportional to the amount of time invested in transportation (Moreno et al., 2021). The transport modes and time may be modified to fit a specific location (as long as they don’t include private cars), matching the more general idea of chrono-urbanism, which focuses on providing a wide offer of urban services within a specific temporal distance.
Cities across the world have started their own chrono-urbanism plans:
- Portland (Oregon, USA) was one of the earliest city to have established its 20-minute city plans in 2012.
- Shanghai in 2016 published the “Shanghai planning guidance of 15-minute community-life circle”
- Plan Melbourne 2017-2050 is a metropolitan strategy that integrates the 20-minute neighbourhood concept.
- Paris has introduced the 15-minute city concept in 2020, during the COVID-19 Pandemic.
While there are several spatial metrics that may support the planning of accessible and diverse cities, there was a lack of a measure that answers the key question:
Are the key urban amenities accessible within a given distance from each location?
Land use proximity and functional completeness proposed by Sara address this issue to help cities and designers make informed decisions about land use and spatial configuration.
What is land use proximity ?
Land use proximity is a binary metric showing whether a service of a specific category is accessible within a specified temporal distance. The coloured segments in Animation 1 indicate all areas which have a specific amenity available within a 5-minute walking distance.
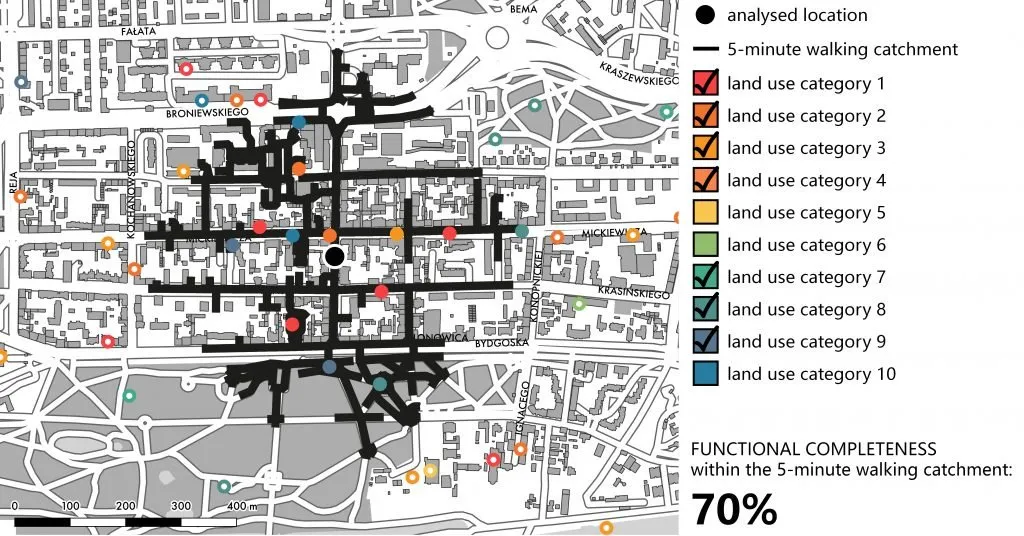
What is functional completeness?
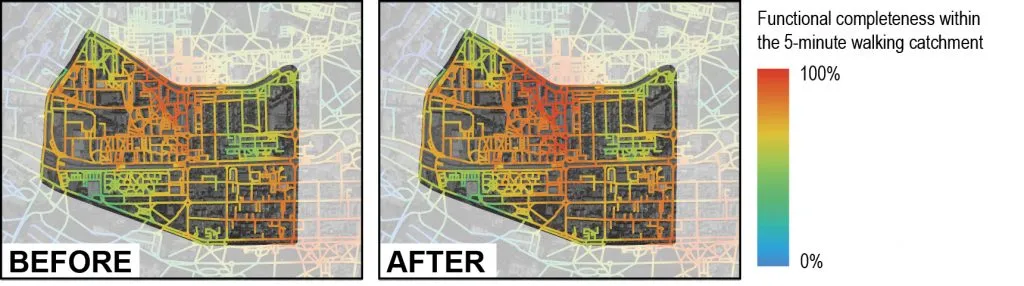
Functional completeness is based on land use proximity and indicates the ratio of key amenities available within a specific catchment, showing how many of the key urban amenities are accessible within a given distance. Animation 2 shows the functional completeness for the study area represented in a colour gradient, where the coolest tones represent the areas where least of the key amenities are within a specific catchment and the warmest tones indicate the locations from which all land uses are within the given catchment. Since the metric is binary, multiple instances of a single category do not affect the results, which makes functional completeness a measure of both proximity and diversity.
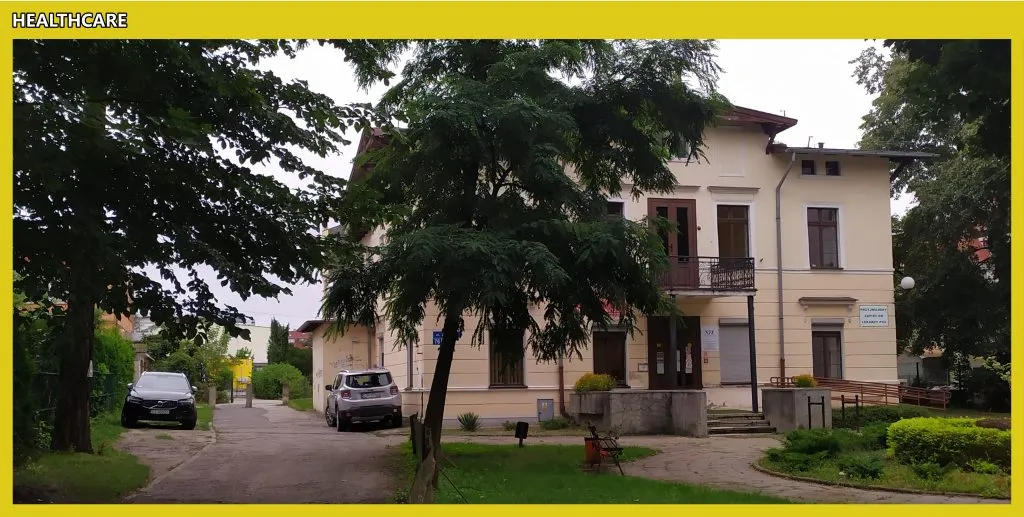
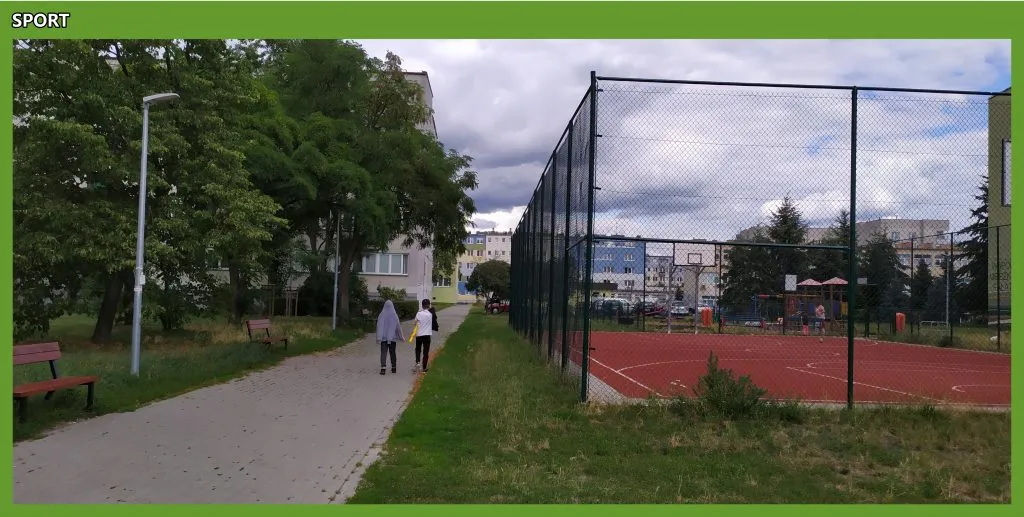
The land use categories can be modified depending on the cultural and socio-economic context and may cover either the most popular travel destinations or the services that are critical to the healthy functioning of the area in question.
How were these metrics generated ?
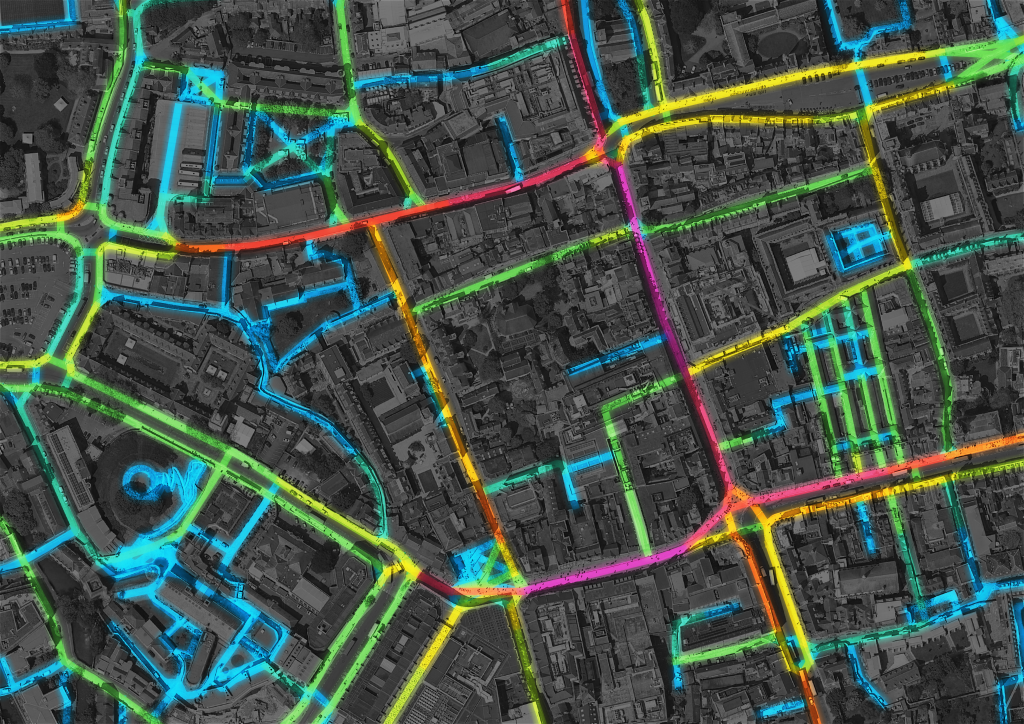
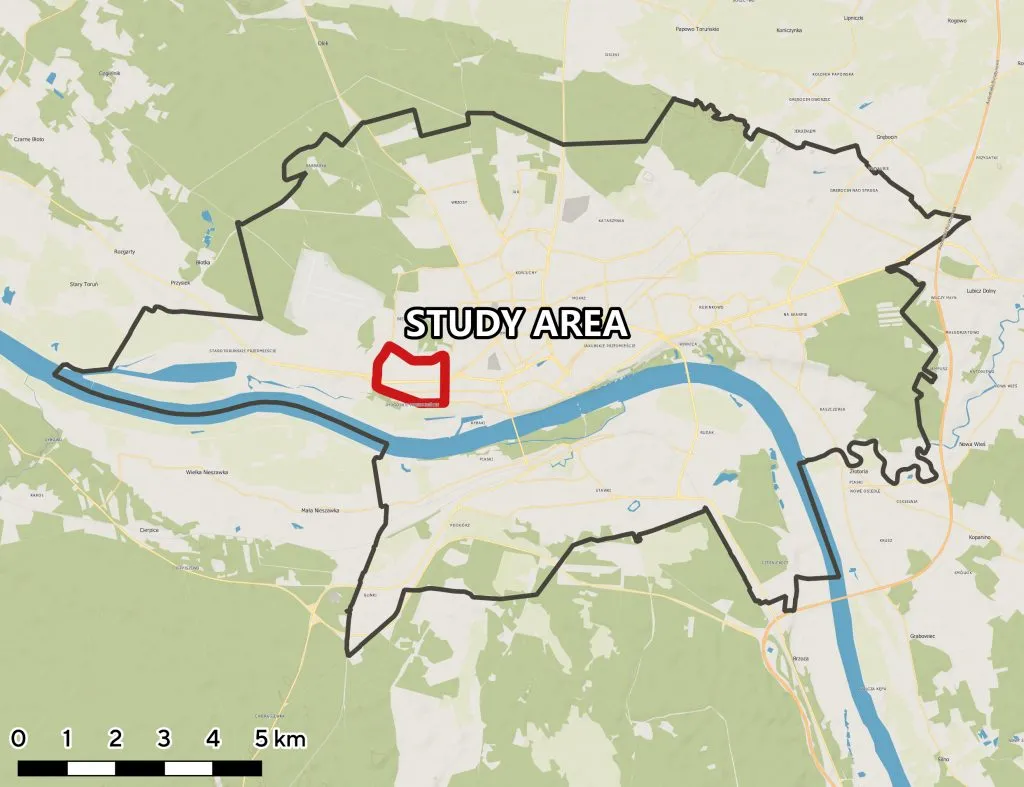
Both land use proximity and functional completeness require two sets of data: a spatial network and land use data, which can be represented by Points of Interest (POIs) and polygons. The tools were developed using a spatially and historically diverse area in Toruń, Poland, using walking as the transport mode due to its unique character as the most natural transport mode, an element of other activities and most universal form of physical activity.
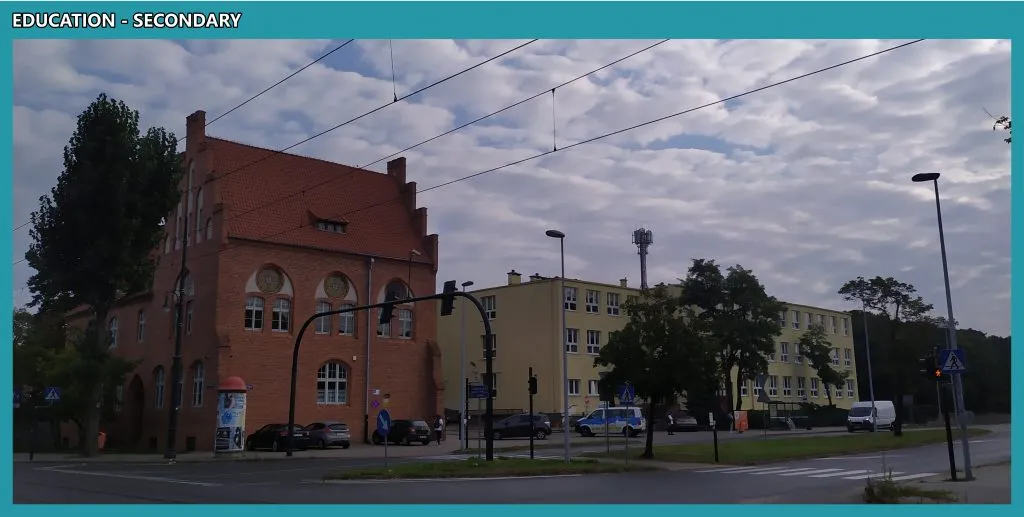
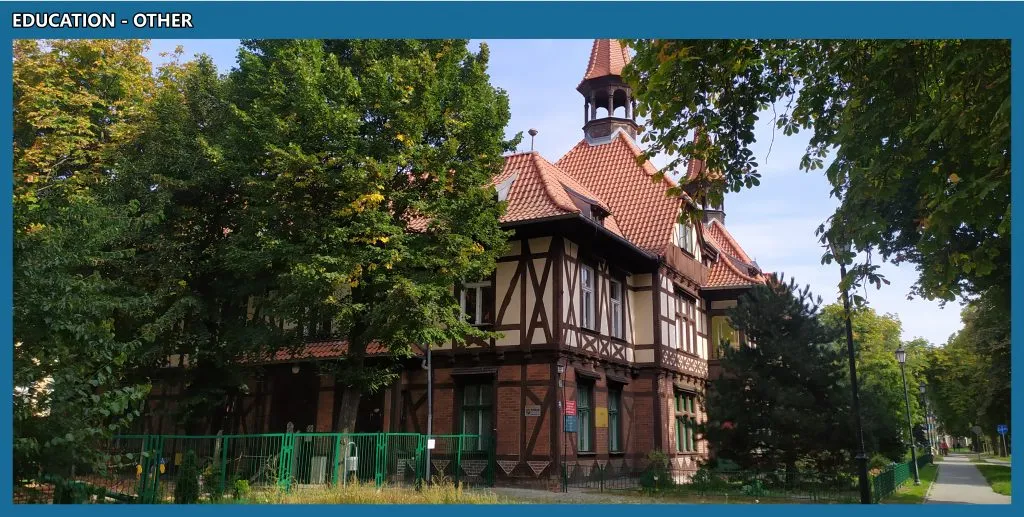
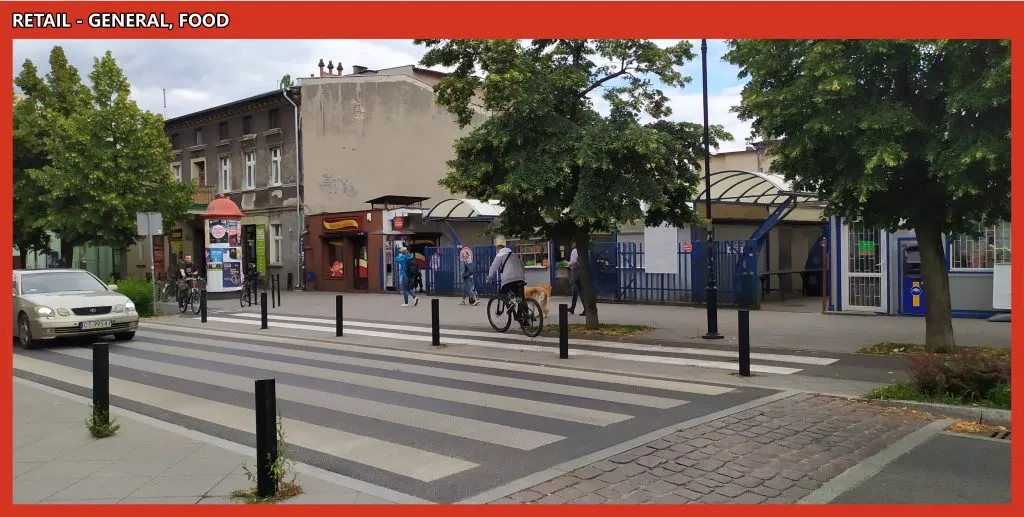
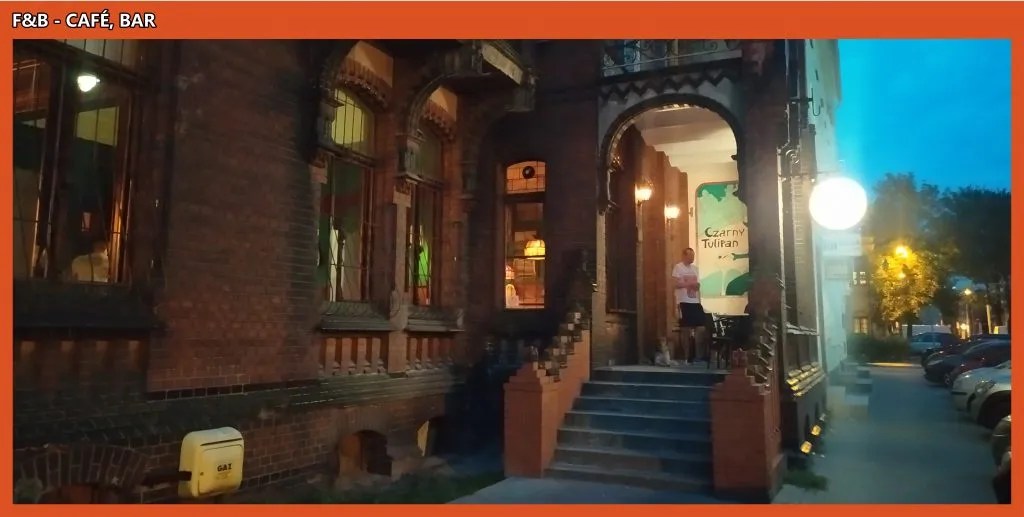
A detailed pedestrian network of 231 km was manually digitized for the study area and a 1,200 m buffer corresponding to a distance walked in 15 minutes at a 4.8 km/h speed. Additionally, OpenStreetMap land use data, supplemented manually was used. 20 large land use categories were defined based on the most common travel destinations in the area.
Land use proximity was generated using 3 catchments (5-min, 10-min and 15-minute walk) and 20 categories. Next, it was used to calculate functional completeness to illustrate the ratio of how many of the common travel destinations can be reached within a specific temporal distance.
Why use land use proximity and functional completeness ?
Land use proximity and functional completeness provide vital evidence for city planning, highlighting the missing land uses and areas with low accessibility.
The two metrics can be used to test alternative improvement solutions, using two approaches:
- land use approach – by adding the missing amenities of selected categories and
- network approach –
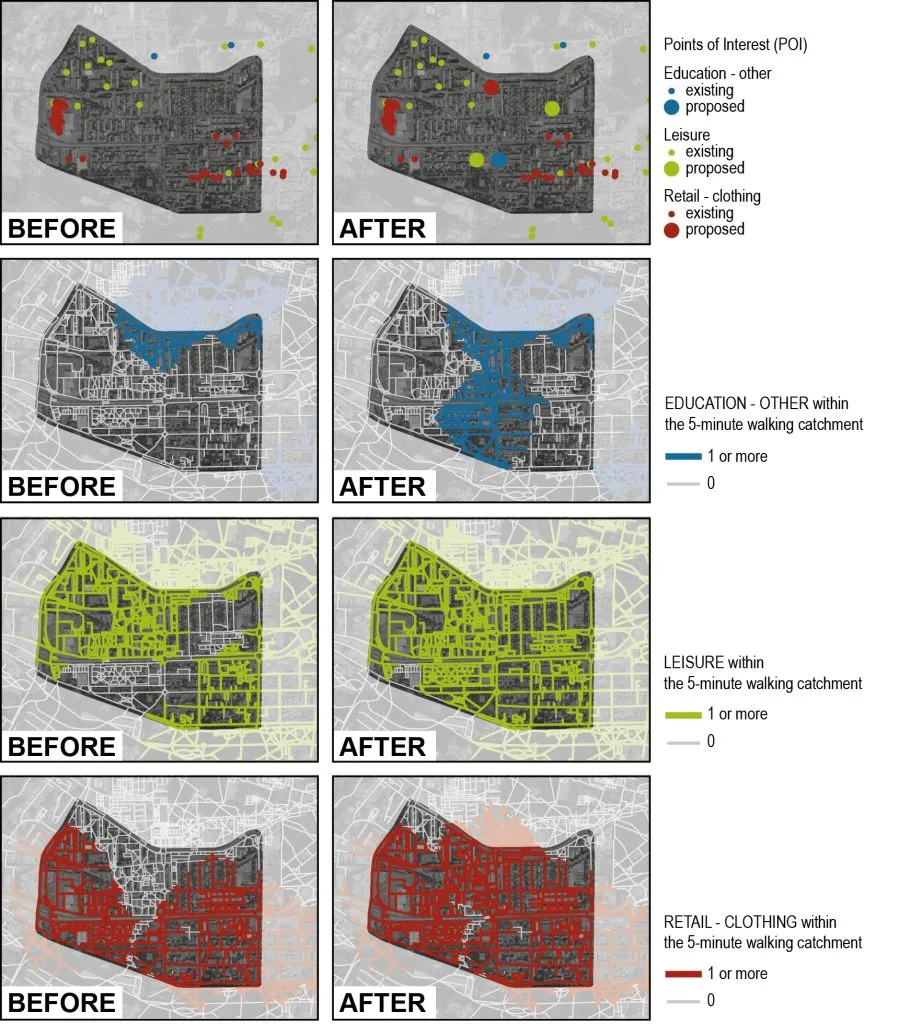
An example of the land use approach is shown in Figure 10. First, the areas in which there was room for improvement of selected categories were identified. Then, new education (other), leisure and clothing retail amenities were added. Both land use proximity (Figure 10) and functional completeness (Figure 11) were improved.
Network approach was shown using a hypothetical example of converting the key barrier to the north-south pedestrian movement into a traffic calmed street with pedestrian priority. The barrier is the main east-west axis, a 4-lane Broniewskiego street with a tram line in the central reservation, high traffic and sparsely distributed pedestrian crossings.
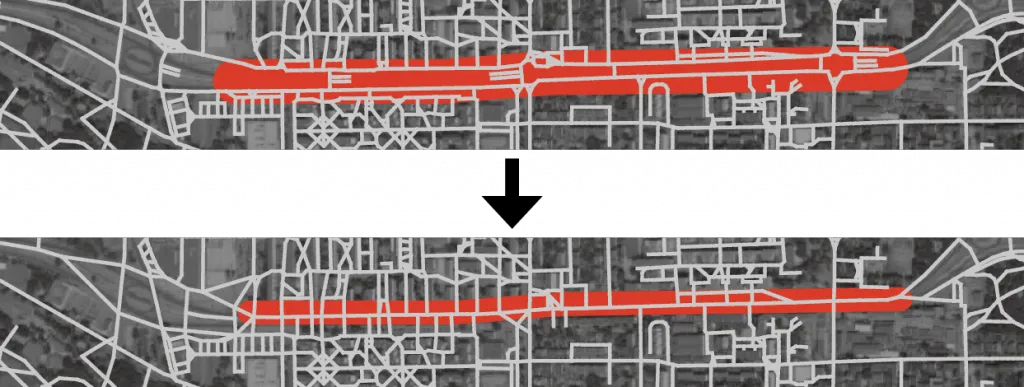
The hypothetical changes were coded in the network, showing Broniewskiego street before interventions as two sidewalk centrelines connected only in the designated locations, while the improved street with pedestrian priority as a single road centreline, enabling free movement flow between the north and south, as shown in Figure 12.
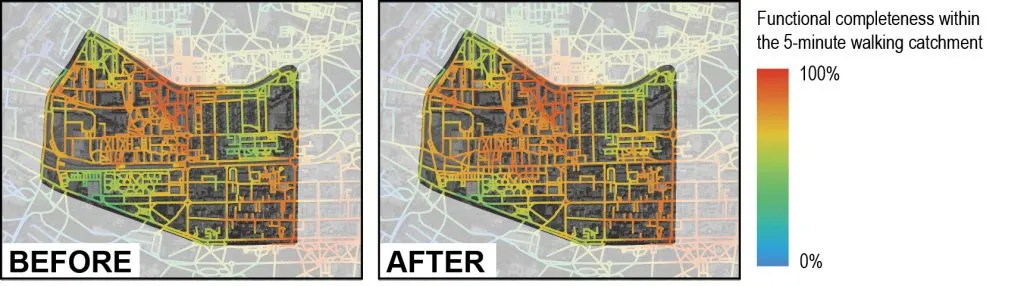
The proposed changes led to significant improvement of functional completeness, visible in Figure 13, indicating that many more of the key land uses were available in a shorter distance. While land use approach enables instant improvement of specific land use proximities, the network approach remains more stable as the land uses inevitably change in time.
Conclusion
Cities around the world are now taking action to create vivid, mixed, and environmentally friendly spaces by implementing policies and design guidelines. To achieve that we need to radically change our approach to building cities.
As presented, land use proximity and functional completeness tools can directly be applied to planning processes and used as scientific evidence to support the creation of diverse and accessible 15-minute cities.
Finally, these tools can assist planners and policy makers in creating diverse and accessible cities reducing excess travel. This can support the critical shift from car-centric cities to healthy, resilient and liveable spaces for people.
Sara joined the Wedderburn Transport Planning team as a Transport Planner. She works on transport analysis, transport system design, GIS and spatial planning. She specializes in 3D spatial network analysis and parametric modelling.
Sara has broad experience in fields of transport, architecture and civil engineering. She has previously worked in the public sector which included a range of transport and master planning projects for urban mixed-use sites as well as developing movement planning tools. Her main research interests include urban mobility, active travel, network configuration and the complexity of urban systems.
Sara has completed her Master thesis analysing the correlation between the detailed pedestrian path configuration, land use characteristics and the pedestrian traffic in a historical district of Bydgoskie Przedmieście in Toruń.